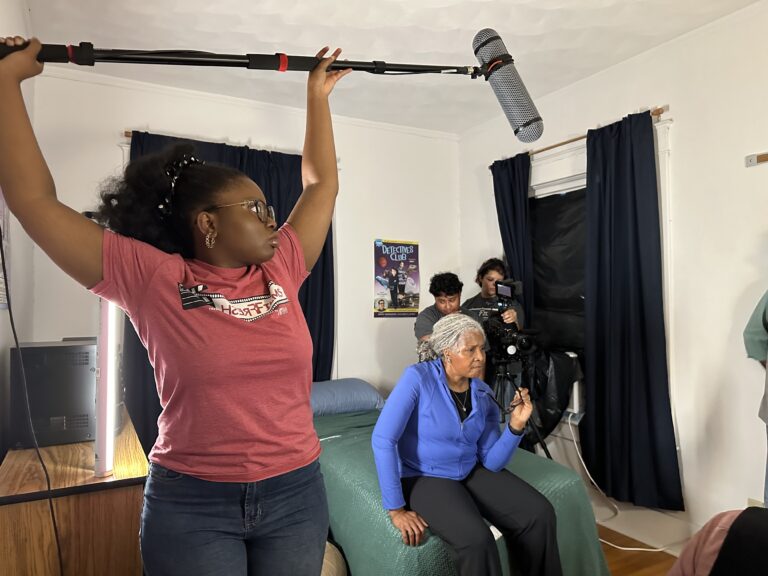
These statistics for developers and employers are in the Quad Cities Regional Laborshed Area Analysis by Iowa Workforce Development and the Iowa Economic Development Authority. CREDIT: IOWA WORKFORCE DEVELOPMENT
Community leaders working to grow the Quad Cities region and employers searching for new employees can find a data-driven tool to assist them in the latest laborshed analysis conducted for the Quad Cities. “Our region’s labor force is over 580,000 strong, and many workers are seeking new opportunities,” said Julie Forsythe, the Quad Cities Chamber’s […]
Community leaders working to grow the Quad Cities region and employers searching for new employees can find a data-driven tool to assist them in the latest laborshed analysis conducted for the Quad Cities. “Our region’s labor force is over 580,000 strong, and many workers are seeking new opportunities,” said Julie Forsythe, the Quad Cities Chamber’s senior vice president, business & economic growth. “The laborshed information is helpful when we’re out promoting the region to show a snapshot in time of the available workforce to business attraction prospects. We have a skilled, trained and educated workforce.”The size of that well-educated and well-trained labor pool was set at 581,296 by the Iowa Workforce Development (IWD) and Iowa Economic Development Authority laborshed study. The latest update of the study, which is conducted every two years, was based on data collected in 2020-2021.A community’s laborshed lines are essentially drawn based on employee commute patterns. To determine the boundaries of a laborshed area, local employers supply the residential ZIP codes of each of their employees. The data in the study reflects characteristics specific to the workforce in the Quad Cities region. The Quad Cities Regional Laborshed Area Analysis can be found here. The regional analysis is based on aggregated data from the laborshed studies for Clinton and Muscatine Counties in Iowa, and the Iowa/Illinois Quad Cities, the report said.According to the executive summary, the agencies’ Study in Labor Availability and Workforce Characteristics geographically defines which communities contribute to the Quad Cities’ workforce, regardless of state or political boundaries. For example, the Quad Cities region’s report area runs from 143 miles north at Palo, Iowa, south to Walnut, Illinois. And it runs 169 miles west from Durango, Iowa, to Burlington, Iowa.According to the analysis of Quad Cities labor patterns, the average commute time for regional workers is 16 minutes or about 11 miles one-way.Other interesting statistics about the region’s employed workforce include:
33% of those who have a job now are likely to accept a new opportunity, and 28% are actively seeking employment.
Almost 80% of the labor force has an education beyond high school and they are willing to commute 34 minutes one-way to work.
For the non-employed, data include:
70% of those without a job are likely to accept employment and 60% are actively seeking work.
More than 70% of the unemployed have an education beyond high school and they are willing to commute 31 minutes one-way to work.
53% of homemakers and 28% of retirees are likely to accept employment.
The region’s top five industries for employed workers are:
Manufacturing: 17% or 97,350 workers.
Wholesale and retail trade: 15% or 87,042.
Healthcare and social services: 14% or 79,598.
Education: 9% or 52,684.
Professional services: 8% or 45,239.
The top current benefits that those employed enjoy are:
Health/medical insurance.
Dental coverage.
Pension/Retirement/401(k).
Vision coverage.
Paid holiday.
According to IWD, laborshed data is unique to other traditionally available labor market information for several reasons: “It is supply-side data. It is specific to the workforce characteristics of labor available in a defined employment center,” the agency said. “It isn't based on employer needs or current employment level, but rather, documented labor availability.”Data information is collected within the geography of the commuting pattern of an employment center. It is not restricted by political boundaries, or county or state lines. All communities that are identified as being significant contributors to an employment center's workforce are surveyed, which provides a more accurate estimate of potential labor.Survey questions allow economic developers, community leaders and employers to identify pockets of labor that are not easily identified elsewhere such as homemakers likely to re-enter the workforce, among others. According to IWD, the number of homemakers who reported they are likely to accept employment has increased throughout the state.The chamber also highlighted these “Workforce by the Numbers” statistics from the 2021 Quad Cities Regional Laborshed Study:
An estimated 278,000 individuals indicated they are very likely to change or accept employment.
79.5% of those currently employed have an education beyond high school.
40 colleges and universities within a 90-mile radius produce 40,000 graduates/year with 159,383 students enrolled.