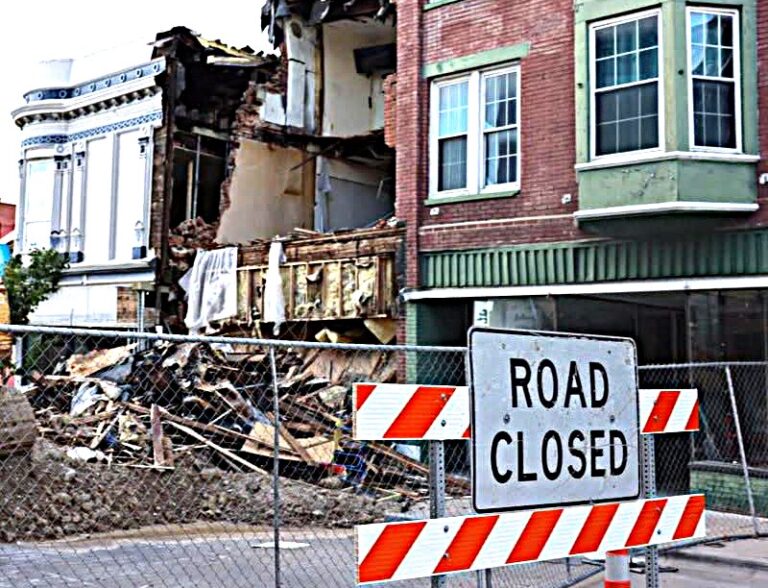
Muscatine considering next steps after downtown building issues
QCBJ News Staff
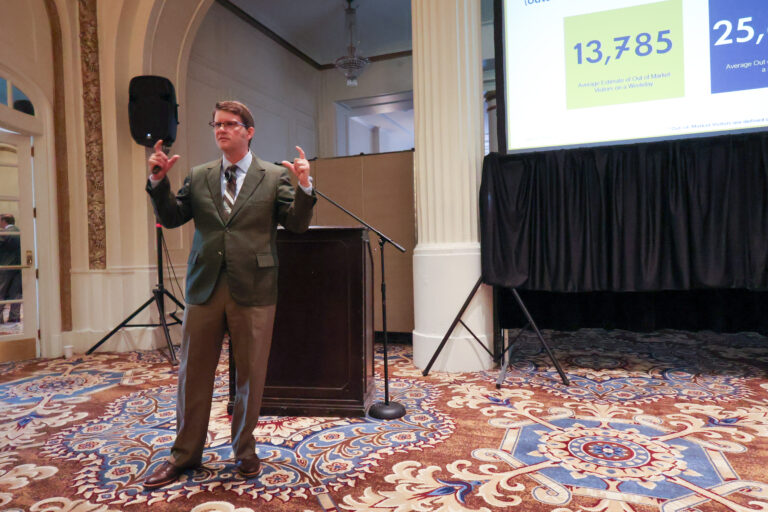
Laborshed studies, like the most recent one for the Quad Cities region, are not just a great tool for communities seeking to grow their population and tax bases.
The Iowa Workforce Development (IWD) analysts who produce them say the data they collect are important resources for governments, developers and employers seeking to grow their workforce.

Get immediate, unlimited access to all subscriber content and much more.
Learn more in our subscriber FAQ.
Do you want to read and share this article without a paywall?